Technical Indicators - Demat Master

Different Demat Account In Market !!!

Choose Your Investment Platform

::
Feature Upstox Zerodha Angel Broking
Account Opening Link Angel Broking
Commission Charges Varies Varies Varies
Research & Analytics Upstox Pro trading platform Kite Angel Eye
Account Opening Process: Online Online Online/Offline
Number of Client: approx 6.5 Lakh approx 3 Lakh approx 5 Lakh
Earning Per day: approx 2000 Cr approx 900 Cr approx 1300 Cr

Indicators for Technical Analysis in Trading

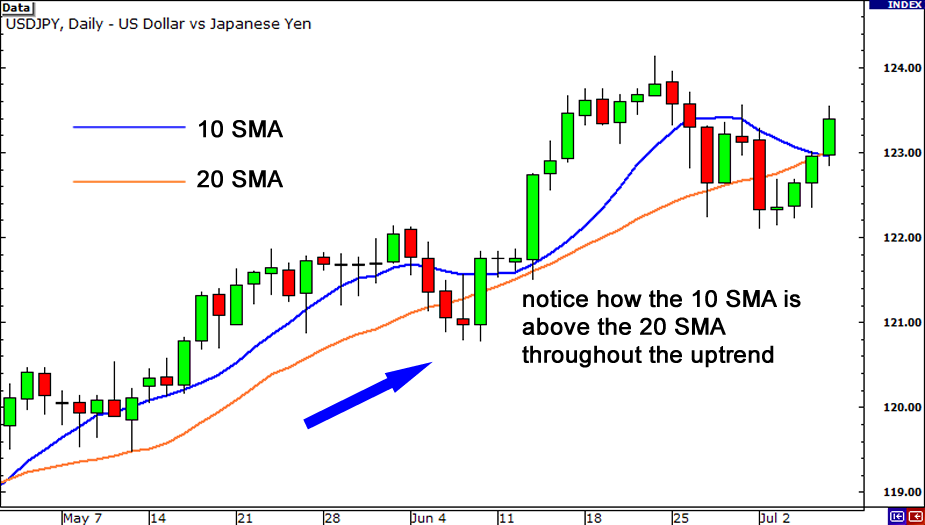
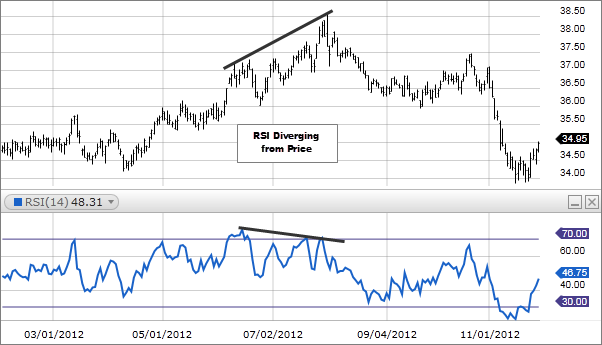
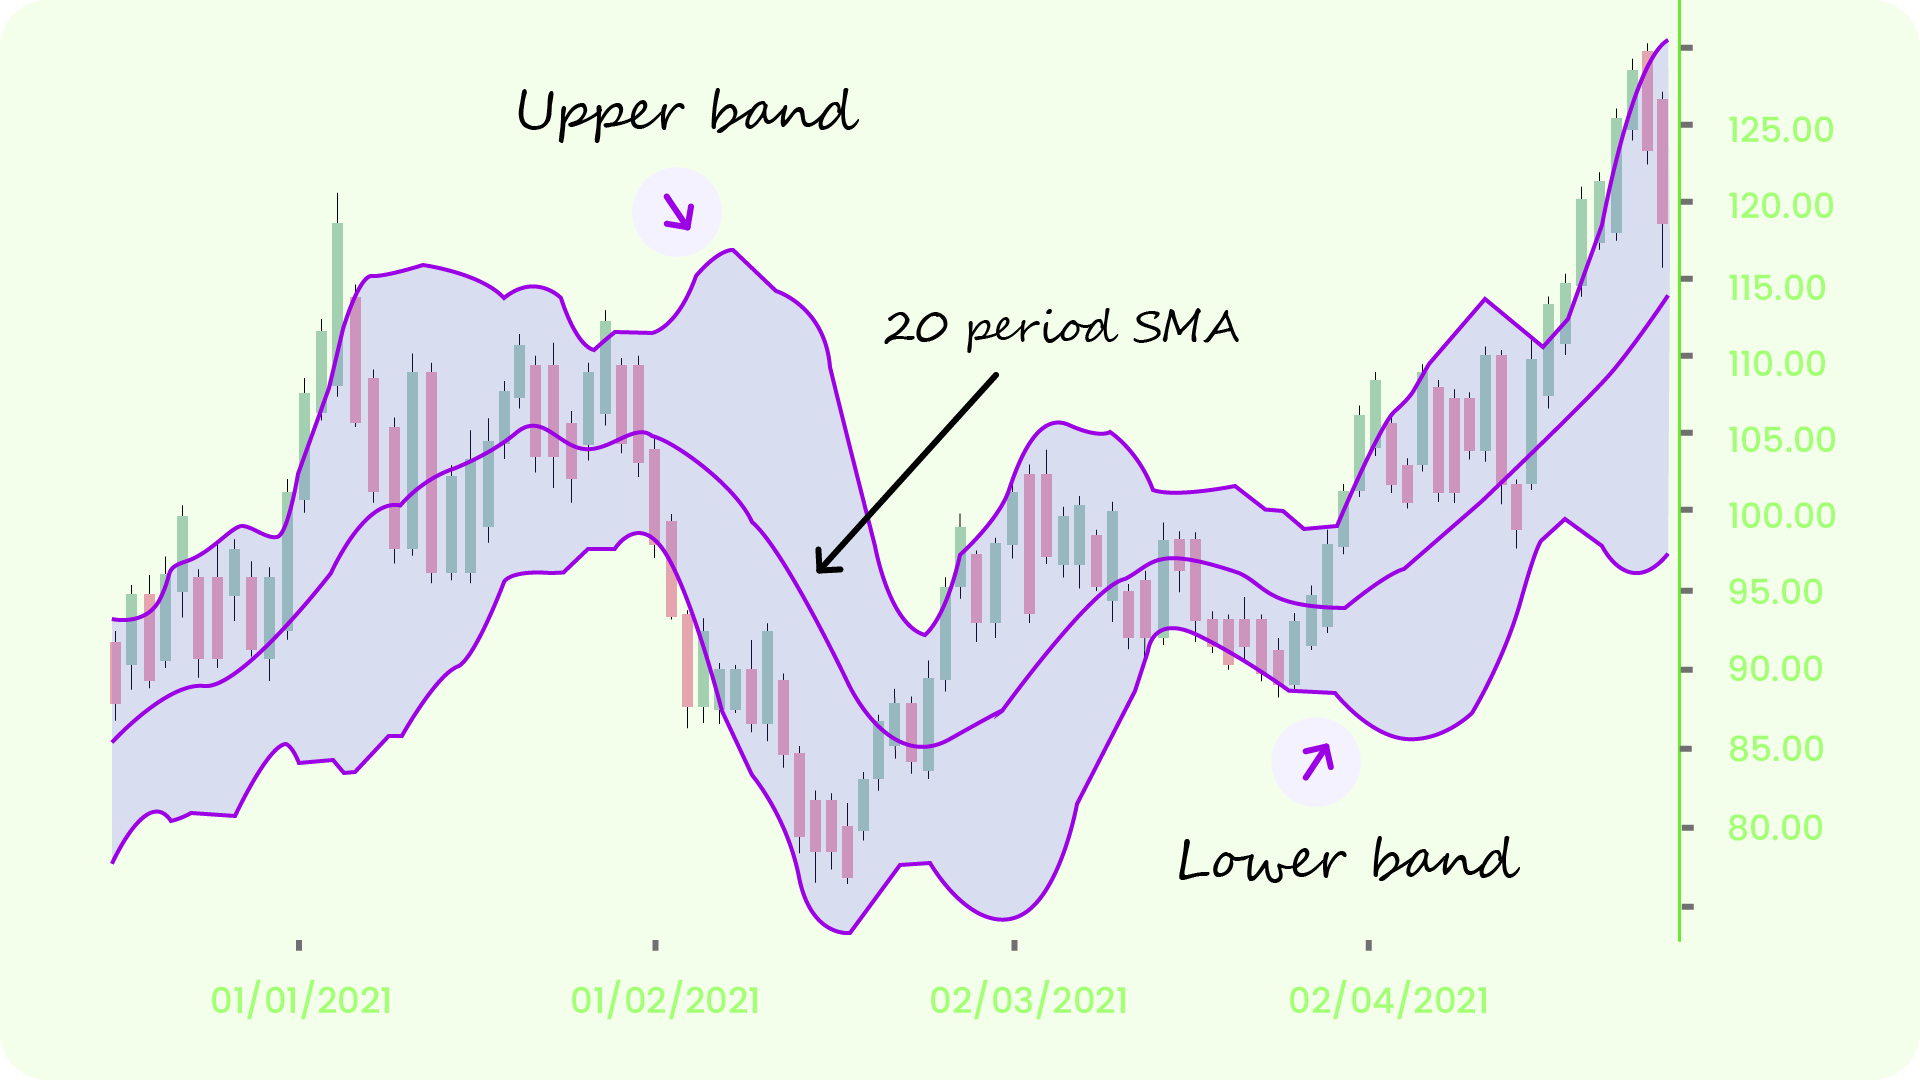
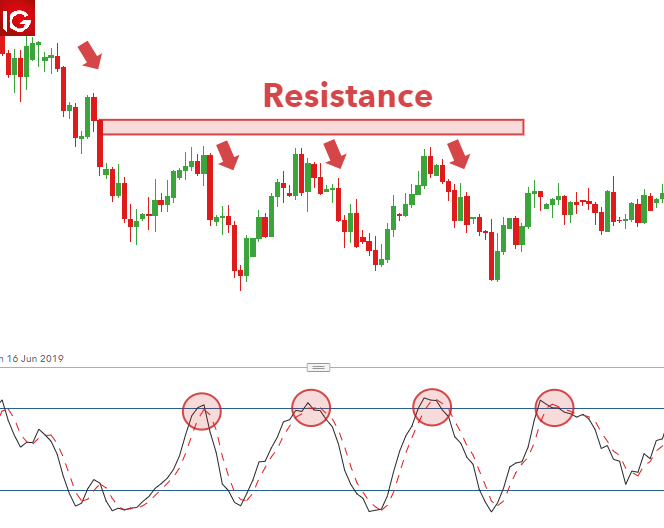
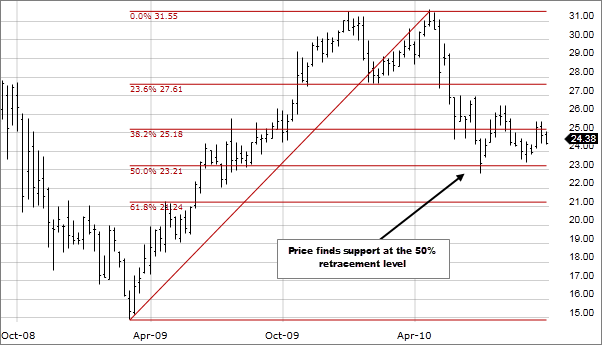
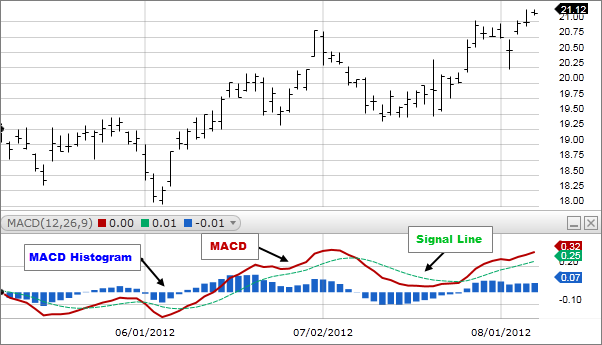
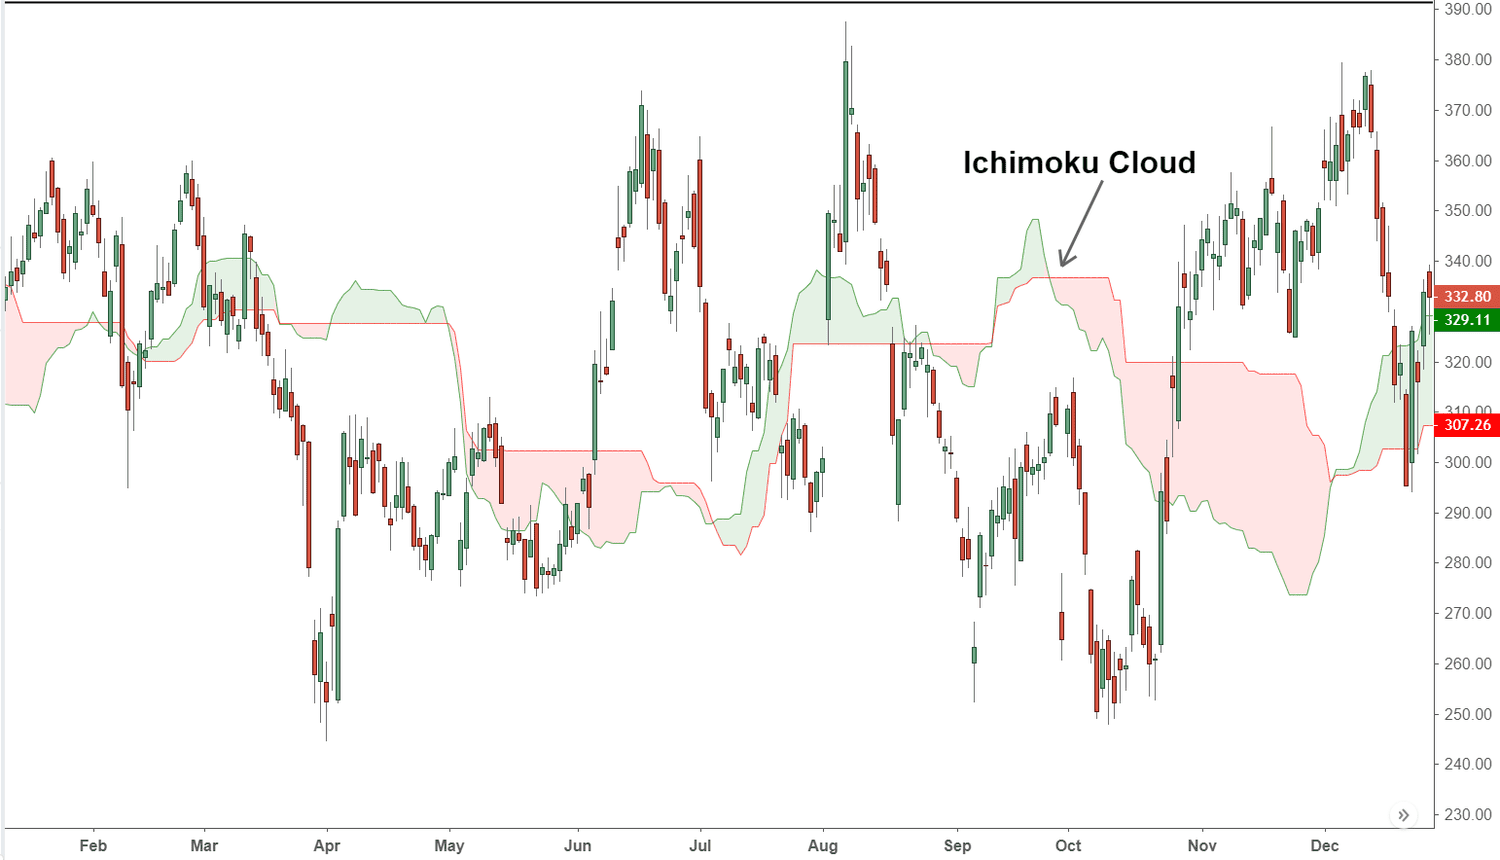
Indicators are tools used by traders to analyze market trends and make informed trading decisions. Here are some common indicators used in trading:

  • 1. Moving Averages: A moving average calculates the average price of an asset over a specific time period and helps traders determine the overall trend of an asset.
  • 2. Relative Strength Index (RSI): The RSI is a momentum oscillator that evaluates overbought or oversold conditions in the market by measuring the magnitude of recent price changes.
  • 3. Bollinger Bands: Bollinger Bands measure volatility by using a moving average and standard deviation to create upper and lower bands around a price line.
  • 4. Stochastic Oscillator: The Stochastic Oscillator compares an asset's closing price to its price range over a specified time period to predict the asset's next move.
  • 5. Fibonacci Retracement: Fibonacci retracements identify levels of support and resistance in an asset's price action by plotting horizontal lines on a chart to indicate where prices may potentially find support or resistance.
  • 6. Moving Average Convergence Divergence (MACD): The MACD is a trend-following momentum indicator that shows the relationship between two moving averages of an asset's price.
  • 7. Ichimoku Cloud: The Ichimoku Cloud uses a combination of moving averages and support/resistance levels to identify potential trend changes and market momentum.
  • Traders often use these indicators in combination to gain a more complete picture of market trends and make better-informed trading decisions.

    Share on Facebook Share on Twitter

    Moving Averages

    Moving Averages Indicator

    Relative Strength Index (RSI)

    RSI Indicator

    Bollinger Bands

    Bollinger Bands Indicator

    Stochastic Oscillator

    Stochastic Oscillator Indicator

    Fibonacci Retracement

    Fibonacci Retracement Indicator

    Moving Average Convergence Divergence (MACD)

    MACD Indicator

    Ichimoku Cloud

    Ichimoku Cloud Indicator